First And Last Mile in Public Transport
Regardless of the spatial coverage of public transport and which mobility modes will eventually be available on the roads – walking will always be a component of urban mobility. The design of the first and last mile can be an important factor in the decision to leave one’s own car behind or not to buy it in the first place. From the perspective of cities and municipalities, it is therefore essential to promote walkability and accessibility in their neighbourhoods, for example by improving the infrastructure, establishing mixed use or providing alternatives for unacceptably long distances. It is therefore in public interest to understand how far residents of a neighbourhood have to walk before boarding a bus or train. How does this depend on the day, time or location? And where do they walk?
Connection requests as a data source
Collecting meaningful data is not easy; after all, sharing geo-location data always invades the privacy of individuals. In this context, alternative data sources that reflect a part of the usage can be useful. For Neu-Hohenschönhausen, we therefore resorted to public transport connection queries. Although not everyone requests an app (considered here) before they start their journey by bus and train, or shares their geo-location with the app – it turns out that connection requests correlate significantly with the actual utilisation of the transport objects. It is thus obvious to include connection requests as a data source for insights into relative movement in the neighbourhood in order to derive hypotheses from them and design further studies, e.g. in the context of on-site real laboratories.
Interactive geo-visualisation
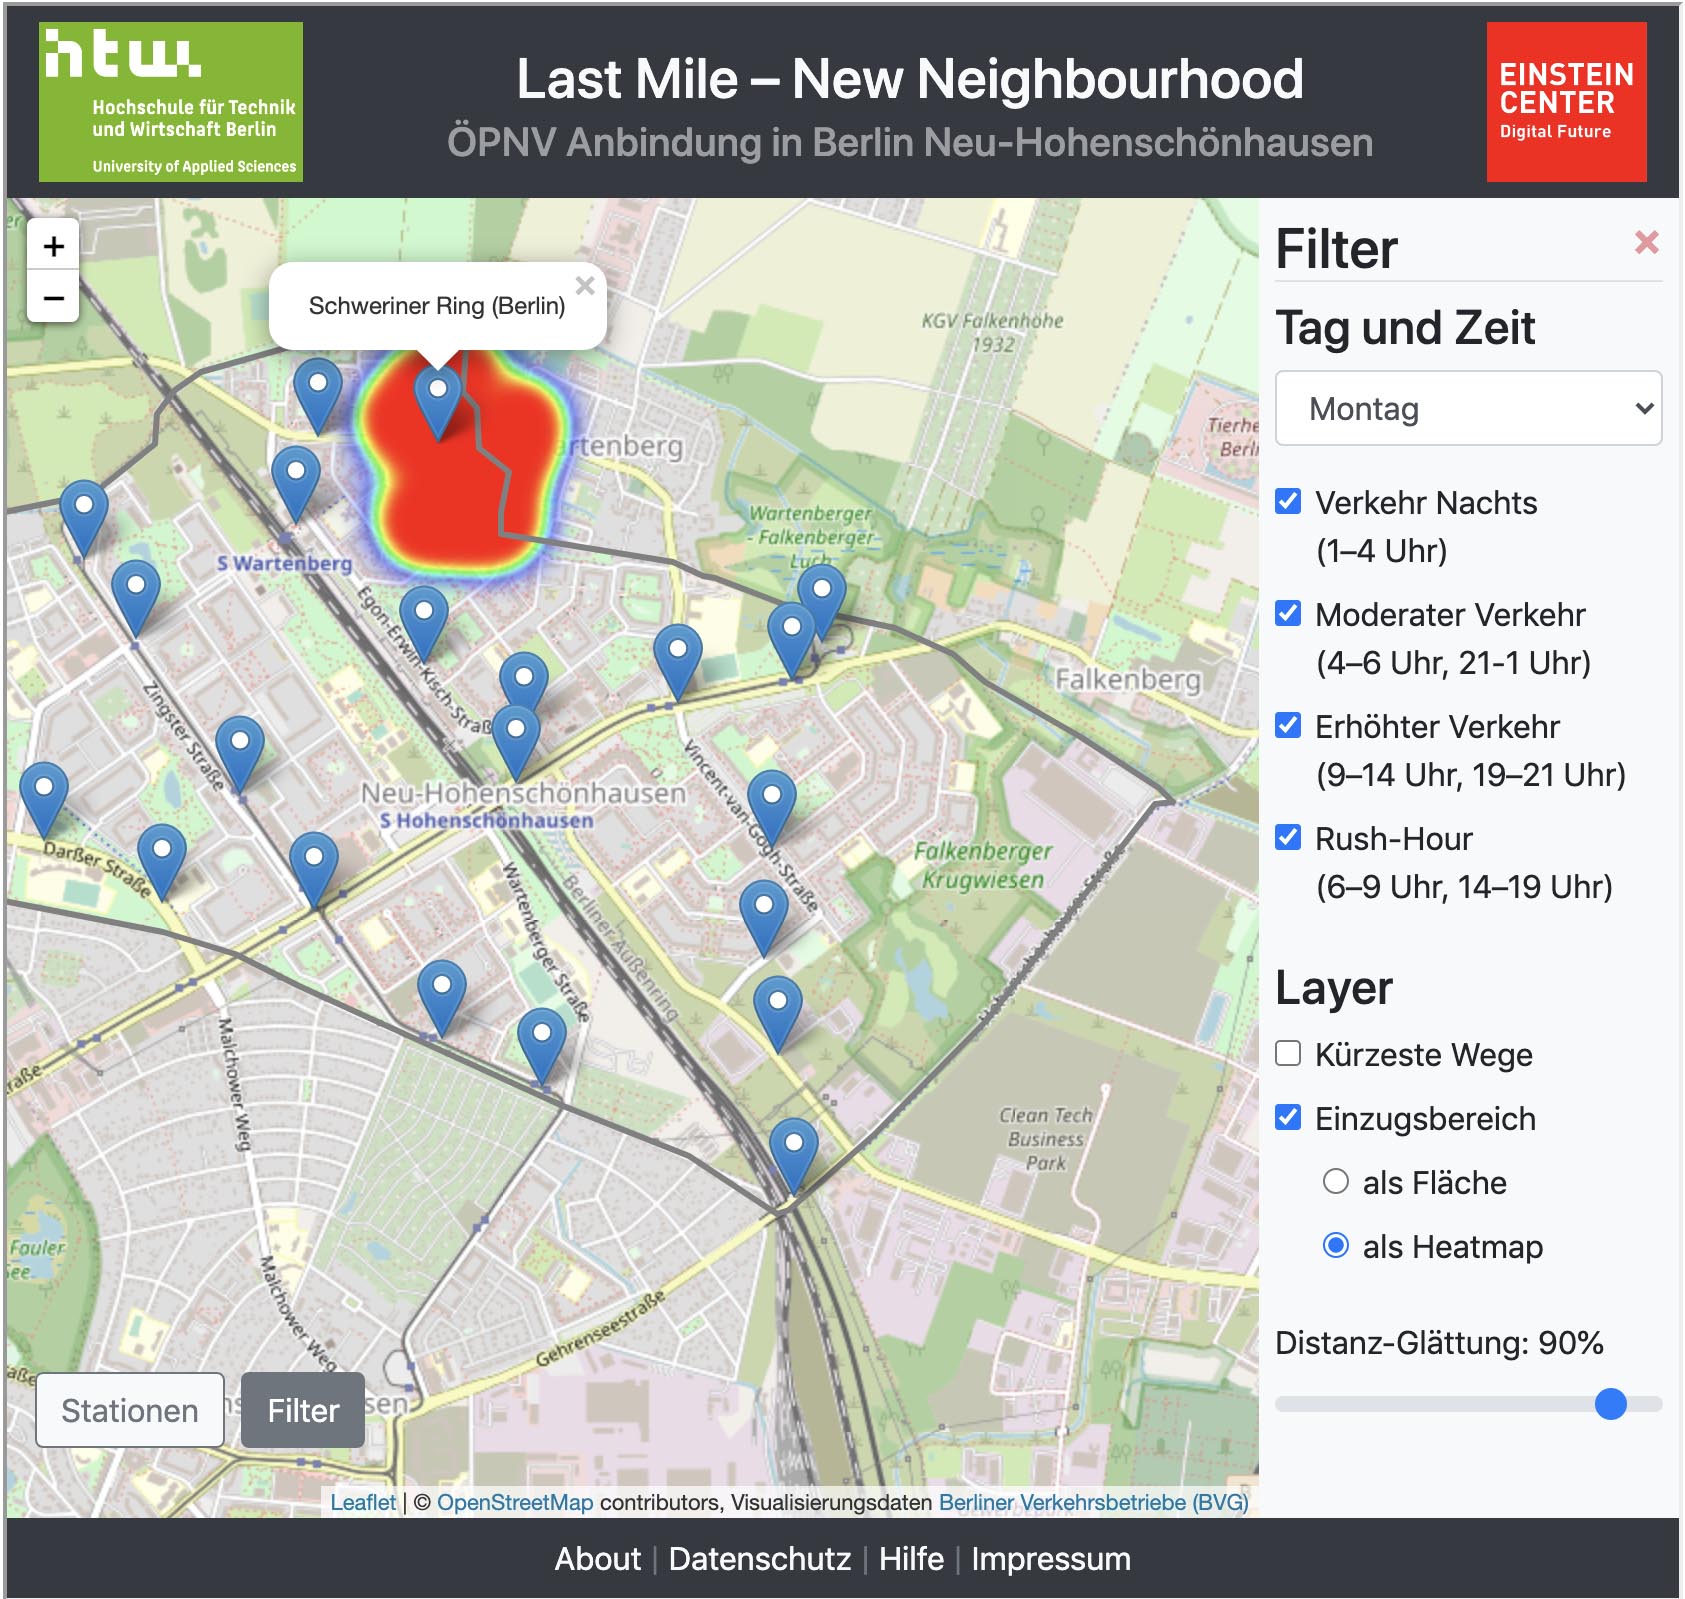
For Neu-Hohenschönhausen, we prepared the first suggested connections through around 290,000 requests to apps and websites of the BVG from the period from 21 June to 18 July 2017 as an interactive web visualisation. From the perspective of the bus/train stops, it is shown which requests came from which area for which selected stops and which was the first or last stop on the requested journey. By providing various filters, the suggested journey times can be compared on different days or at different times of day. Statistical evaluations also show how far citizens have travelled on average from the respective stops and what the most frequent destinations were. With up-to-date and comprehensive data, it would be possible to gain insights into the attractiveness of public transport for certain destinations, the use of the nearest smaller stops, as well as a better understanding of the presumed distance travelled on the way to the first stop or home.
This prototype implementation aims to demonstrate the potential of interactive privacy-friendly data visualisations in the context of urban planning. By democratising the data from public space, participation processes can be promoted that enable a transformation of the residential neighbourhood with its citizens.
Contact
Prof. Helena Milhaljevic – Analytics and Big Data, HTW Berlin